What do the statistics signify in outreach?
Outreach push notifications are an essential aspect of engaging with attendees and keeping them informed about important event updates and changes. Now, let's dive into what the statistics signify in Outreach:
- Redirection: This indicates the ability to view the target of a redirection. It lets you track how many users actually clicked on the link provided in the notification to redirect them to another screen or external URL.
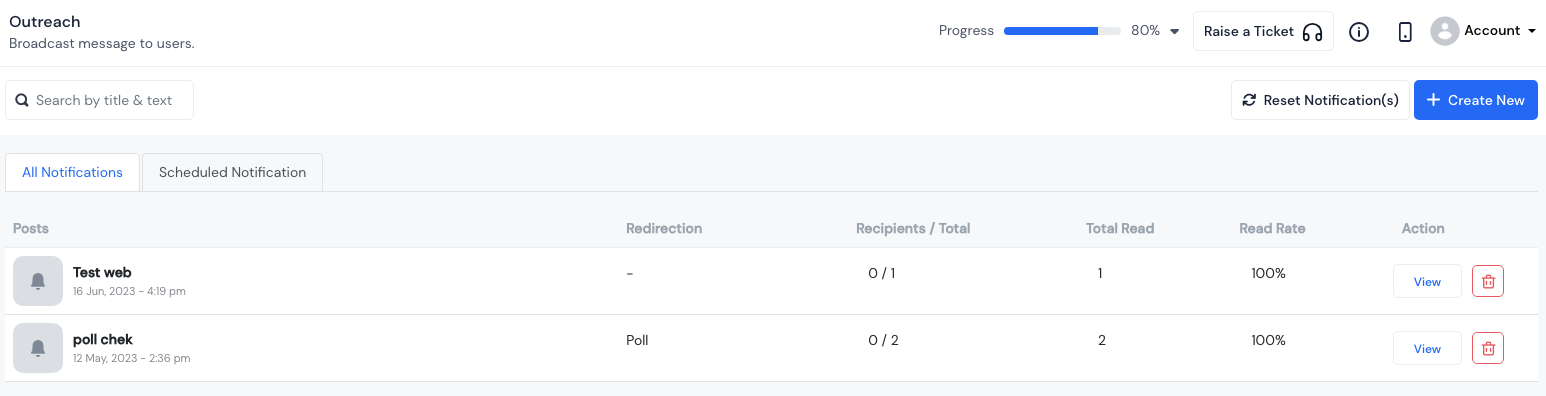
Recipients / Total: This represents the count of recipients out of the total count. It shows the number of users who received the notification compared to the overall number of users eligible to receive it.
Total Read: This denotes the overall count of messages that have been read. It helps you understand how many users opened and viewed the notification.
Read Rate: This refers to the percentage of messages that have been read out of the total sent. It gives you insights into the effectiveness of your notifications and how engaging they are to the audience.
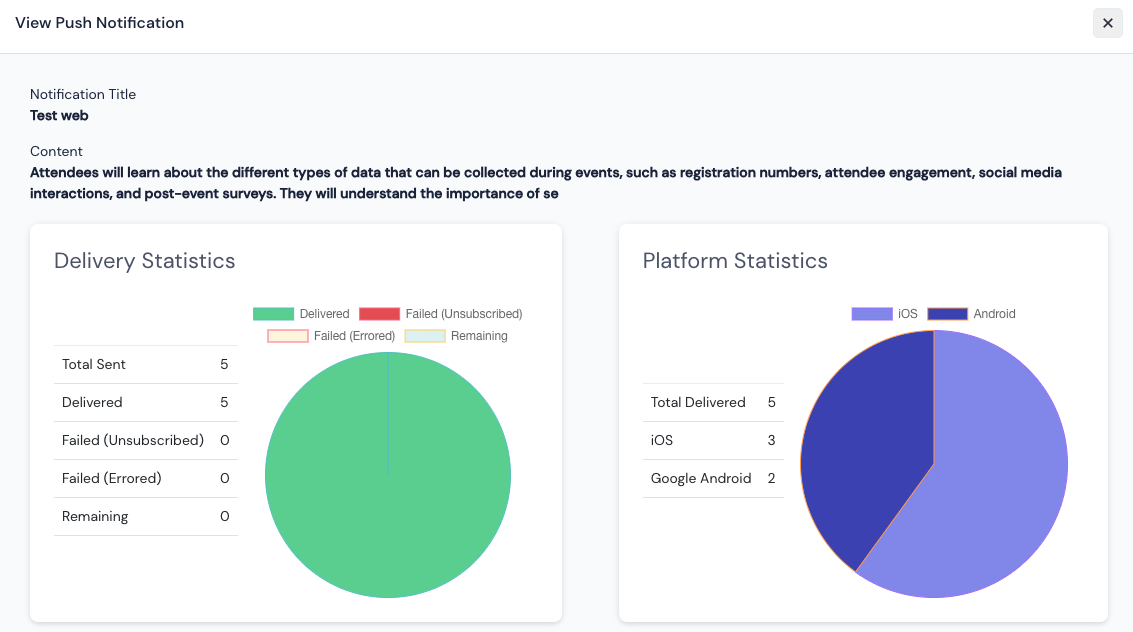
Action: This provides options to view the notification. It displays the pie charts for Delivery Statistics and Platform Statistics related to a specific notification. These charts give you a visual representation of the notification's performance and the platforms (such as iOS, Android, etc.) on which it was delivered.
These statistics are valuable in evaluating the success of your outreach efforts. By understanding how many users received and read the notifications, and how they interacted with the redirection links, you can make informed decisions to improve your engagement strategies and optimize your future notifications for better results.